


There Really Is No Middle Class Any Longer
November 1, 2022 in News by RBN Staff
source: zerohedge
Authored by Lance Roberts via The Epoch Times,
There was a time when a large portion of Americans belonged to the “middle class.” It meant you could afford a decent living standard, such as owning a house and a car and had savings in the bank. When “baby boomers” reminisce about the “good ole days,” they are referring to when being middle-class was normal.

However, the American middle class has continued to contract over the past five decades. According to Pew Research, the share of adults who live in middle-class households fell from 61 percent in 1971 to 50 percent in 2021.
The shrinking of the middle class is accompanied by an increase in the share of adults in the upper-income tier, which increased from 14 percent in 1971 to 21 percent in 2021. At the same time, there was an increase in the share who are in the lower-income tier, from 25 percent to 29 percent. These changes have occurred gradually, as the share of adults in the middle class decreased in each decade from 1971 to 2011, but then held steady through 2021.
The Census Bureau clearly shows the problem in the “mean household income data” through 2021.
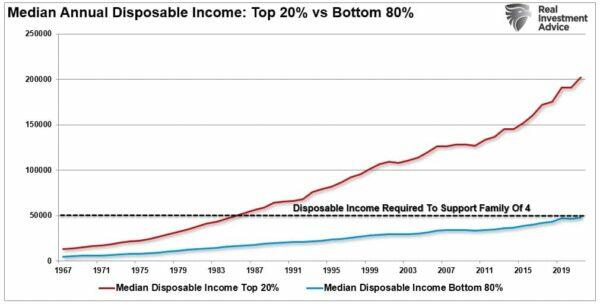
Source: Census Bureau Chart: Real Investment Advice.com
That dotted black line is the most important. As with the PEW Research data, looking at incomes alone obfuscates the most important part of income analysis. The question is, how much income it takes to maintain a “middle-class” lifestyle, or rather, what does it take to buy a house and a car and feed two kids?
Most importantly, and what is often not included in the analysis, is the standard of living gets “paid for” on an “after-tax” basis. When we include taxation, it becomes clear that roughly 80 percent of America is failing to support the “middle-class” lifestyle.
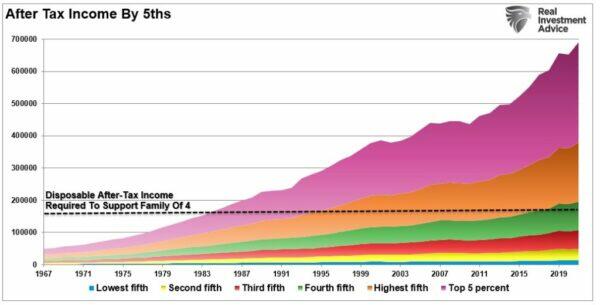
Source: Census Bureau Chart: Real Investment Advice.com
As we discussed recently, Harvard Business Review noted: “Besides a booming labor market, exceptionally strong household balance sheets help keep spending high. Households’ net worth is far higher than pre-COVID for every single income quintile, providing some buffer to the headwinds of inflation and dour consumer sentiment.”
Again, it is a true statement that household net worth has increased since the COVID lockdown lows. However, household net worth is predominately held by the top 10 percent of income earners, leaving the bottom 90 percent fighting over the remaining 30 percent of the wealth.
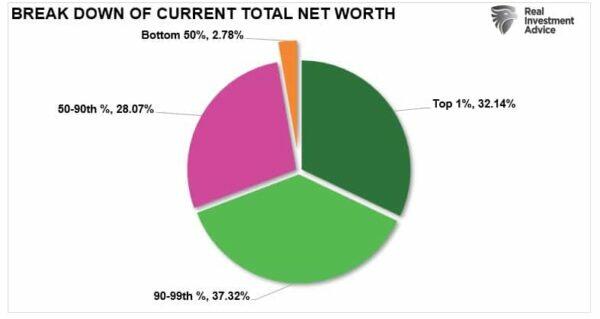
Source: St. Louis Federal Reserve Chart: Real Investment Advice.com
More Debt Isn’t A Choice
Debt is not a choice for most “middle-class” Americans.
I recently discussed “Recession Fatigue” that is plaguing more individuals, according to a BankRate.com survey. To wit: “When broken down by generation, younger adults, or Gen Zers, are more likely to experience ‘recession fatigue’ than millennials, Gen Xers, and baby boomers. In the report, ‘recession fatigue’ is primarily afflicting younger generations, leaving them unprepared to face a recession. Such data certainly flies in the face of media reports of households having ‘strong financial balance sheets.’”
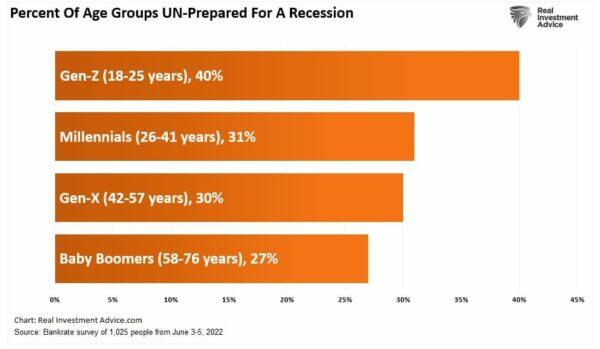
With the Federal Reserve focused on combatting inflation by tightening monetary policy, the financial pressures on households will continue to increase. Given already high levels of “unpreparedness” for a recession, such approaches leaves a majority of families dependent on additional debt to make ends meet.
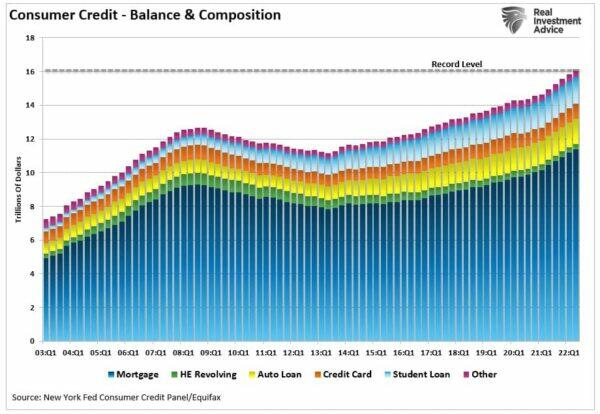
“According to the latest New York Federal Reserve report, credit card debt surged by $46 billion in the second quarter. As shown above, such is not surprising as consumers struggled to maintain their standard of living. The 13 percent annualized increase in new debt was the largest in more than 20 years. Moreover, aggregate limits on cards marked their most significant increase in the last decade.”
Source: St. Louis Federal Reserve Chart: Real Investment Advice.com
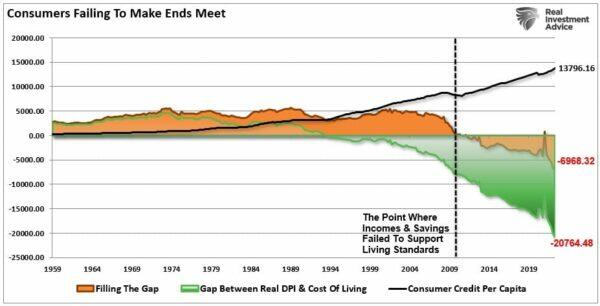
With the pandemic-driven savings now spent, 60 percent of Americans say they are living paycheck-to-paycheck. While consumers can supplement their disposable incomes with debt to offset rising inflationary pressures, this is not a long-term solution. The chart below, which requires a brief explanation, shows the problem clearly.
Between 1959 and 1990, individuals could sustain their inflation-adjusted standard of living with only incomes and savings. There was roughly a $4,700 surplus yearly as households had very low debt levels. However, beginning in 1990 and accelerating following the Financial Crisis in 2008, households required an increasing level of debt to “fill the gap” between what income and savings could afford and the cost of the current living standard. You will notice a brief spike in 2020-2021 as “stimmy checks” hit household bank accounts. However, that surplus has reversed to the deepest deficit on record.
Source: St. Louis Federal Reserve Chart: Real Investment Advice.com
As the “wealth gap” continues to widen between those in the top 10 percent of income earners and everyone else, the ability to maintain a “middle-class” lifestyle becomes more challenging.
The Road To Serfdom
A recent U.S. News article outlined the many forces that shape an individual’s economic class and their views of where they rank.
“When asked how they identify their social class, 73 percent of Americans said they belonged to the middle or working classes, according to an April 2022 survey from Gallup. Fourteen percent identified themselves as an upper-middle class and 2 percent categorized themselves as upper class. In determining their social class, people often don’t just think about income, experts say, but other factors, including education, location, and family history.”
However, statistics suggest that if 89 percent of surveyed individuals identify as middle to upper-class, that only leaves 11 percent of the population at the other end. However, income, debt, and net worth statistics clearly show that this is not the case.
The reality is that middle-class America continues to shrink as the rich-get-richer and poor-get-poorer. The rich can invest, save, and use very little debt to sustain their living standard, while the poor rely on debt, making long-term prosperity an impossible goal.
Furthermore, as the peasants demand “more free stuff” from the government, such requires more debt and higher taxes. Those demands then divert more capital away from productive investment leading to slower economic growth. As growth slows, businesses shift to the lowest labor costs or automation, lowering income growth for domestic workers. Such leads to more demands for “free stuff” from the government, and the cycle intensifies, pushing more of the middle class downward.
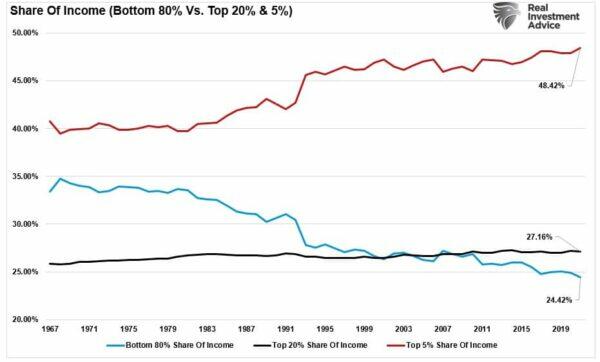
The share of annual incomes between the bottom 80 percent and the top 5 percent is evidence of that wealth transfer from the middle class.
Source: Census Bureau Chart: Real Investment Advice.com
The road to serfdom is paved with good intentions.
After decades of piling on increasing debt levels to generate economic growth, the damage to economic growth is becoming more visible. As shown, economic growth trends are already falling short of both previous long-term growth trends.
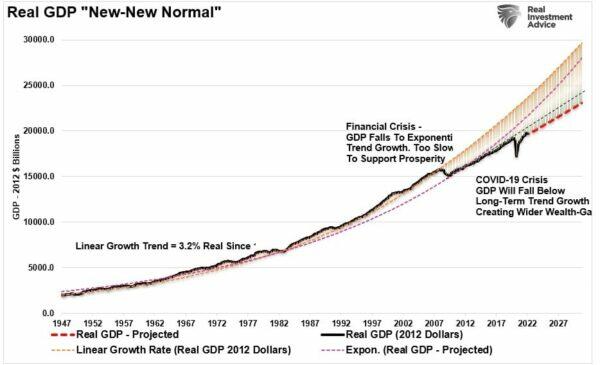
Chart: Real Investment Advice.com
The end game of too much debt, combined with an aging demographic, is the “deflationary disaster” apparent in Japan’s economy.
Of course, Japan doesn’t have a middle class any longer, either.