


Inside September’s “Born Again” Jobs Report
October 8, 2014 in News by RBN Staff
Source: Zero Hedge
Submitted by David Stockman via Contra Corner blog,
The September jobs report was greeted by a flurry of robo-trader exuberance because another print well above 200k purportedly signals that growth is underway and profits will remain in high cotton as far as the eye can see. But how many years can this Charlie Brown and Lucy charade be taken seriously—-even by the headline stalking talking heads who inhabit bubblevision?
For the entirety of this century they have actually been gumming about little more than “born again” jobs, not real expansion of labor inputs to the faltering US economy. In effect, some macroeconomic Lucy periodically removes the jobs football, but after ritual hand-wringing during the recession the charade starts all over again. That is, Wall Street and the financial media resume what amounts to a monthly jobs telethon around the BLS’s massaged, imputed, seasonally maladjusted and incessantly revised establishment payroll guesstimates.
But try the trend of aggregate labor hours. instead. That’s also contained in the BLS report, but it is never cited in context—-only as a meaningless point comparison with the prior month. The better angle, of course, is spans of years and decades because that captures trends and the real course of economic history, not monthly noise and revisions.
Here’s what the trend of labor hours used to look like. Notwithstanding five recessions between 1964 and mid-2000, labor hours grew at 2.1% annually between 1964 and 1980, and 1.8% per year between 1980 and 2000. Throw in a point or two for productivity, and you had 3-4 percent real GDP growth.

By contrast, here’s the trend during the years of maniacal money printing since the year 2000. That’s when Greenspan panicked after the dotcom bust and cut interest rates several dozen times between 2000 and 2003, dropping the cost of money to just 1%. That policy did self-evidently levitate the price of risk assets, but no such thing can be said about aggregate units of labor employed in the private economy. On a peak-to-peak basis during the 81 months of the Greenspan housing bubble of 2001-2007, labor hour grew at only 0.5% per year—-or by just one-quarter of their historic rate.
And during the 81 months of the Bernanke-Yellen bubble since the 2007 peak, labor hours have hardly advanced at all, creeping higher at just a 0.2% annual rate. Stated differently, a tsunami of money has generated but a trickle of employment—-that is, a growth rate of labor hours over nearly a seven year stretch that is just one-tenth of the pre-2000 trend.

In this context, it is also well to recall that while September’s report represented month #81 since the pre-recession peak, there has been no documented act of god abolishing the business cycle during the interim. So given this late stage of the business cycle, it would make sense to look at the cyclical trend, not the monthly delta—even on a gross job count basis including the ones with big pay, little pay and fleeting pay.
Indeed, after 81 months the only relevant metric is the trend: each BLS report is now effectively on borrowed time. Based on the empirically evident condition of the world economy—-Japan’s government is about to concede it is in a new recession, Europe never got out of recession notwithstanding its ECB fueled bond bubble and the China house of cards is hitting the skids harder by the day—it is hard to contend that the US economy is heading for a permanent berth in the nirvana of Keynesian full-employment.
Could anyone still believe in the Great Moderation or that the Fed can deflate the giant bond, stock and real estate bubbles evident everywhere without perturbing the business cycle? So the 81 month test is more than a fair measure of the “progress” that has actually been made since the printing presses were put on open-throttle in September 2008.
The graph below shows the establishment survey jobs count after the cyclical peak in June 1990. As can be seen, 81 month later in March 1997, the job count had risen from 110 million to 122 million. These 12 million new jobs represented a 11% gain from the prior peak.

During the 81 months between the February 2001 peak and November 2007—–the point, incidentally that the S&P 500 peaked last time around—-the gain was not so robust. Still, the pick-up in the gross job count from 132.8 million to 138.4 million amounted to 5.5 million jobs or 4.1%. So now the trend was fading, especially in view of the unsustainable housing bubble jobs contained within the November 2007 total.

Then we get to month 81 of the current cycle. It is evident that the White House’s 10 million jobs claim is blatant propaganda. About 90% of those “new” jobs are actually “born again” jobs—-the same ones that were “created” during the Greenspan housing bubble and endlessly taken credit for by the Bush White House and GOP fiscal derelicts on Capitol Hill.
In truth, the 139.4 payroll jobs reported for September amounted to an 81-month gain of just 1.09 million or 0.7%. That’s right—since the last peak, the US economy has only generated 13,000 genuinely new jobs per month. And that’s before any consideration is given to quality measures such as hours per week and average pay.

In this context, the “deep” recession argument cuts no slack. If the American economy were actually healthy, or if the Fed’s furious money printing was actually boosting the main street economy, the rebound from the deep 2009 bottom would have been robust, not languid. In fact, here is the 81 month rebound from the deep recession of 1981—–the downturn most similar to the Great Recession of 2008-2009. As can be seen, the 5 million jobs lost during the deep downturn of 1981-1982 were recovered within two years of the prior peak, and the overall gain over 81 months was nearly 10 million jobs or 13 %.
Needless, to say that’s what a conventional recovery from a deep recession looks like. By contrast, what has occurred in this cycle is in different ballpark altogether.
Moreover, all of the above is about the raw jobs count. Yet whereas “one man, one vote” is an admirable principle as it pertains to political democracy, it is utterly irrelevant in economics. A 15-hour per week job at McDonald’s counts as one job in the BLS establishment survey, but the pay rate amounts to just 12% of the median full-time job on an annualized basis.
Hackneyed as it sounds, the jobs market is increasingly populated by hamburger flippers, barhops, shoe clerks and bed pan changers. These jobs are almost never full-time, and as a result average weekly hours have been sinking for decades. Accordingly, the 9 million new jobs created during the Reagan era recovery represented far more than 9X the embedded economic output in the 1 million jobs gained during the Bush-Obama cycle.
So the point is simple. The headline jobs number so breathlessly reported each month tells almost nothing about the true employment situation—and most certainly is not a signal to buy, buy, buy an already stupendously inflated stock market. Indeed, when the internals of the jobs count are carefully examined, the story is not about recovery and growth at all; it’s about a continuous deterioration in the mix of jobs reported and the economic value added and income they represent.
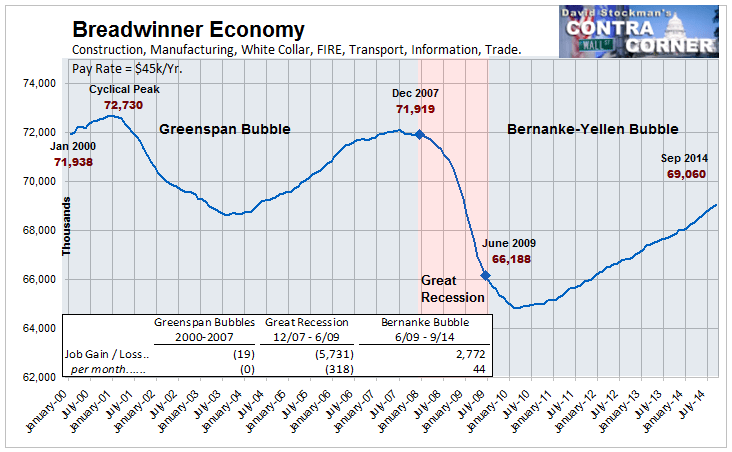
The starting point remains “breadwinner jobs” in construction, manufacturing, the white collar professions, business management, FIRE, distribution and transportation and core government excluding education—jobs which generate upwards of 40 hours per week of work and $50K per year of gross pay. As I have previously indicated, we are not even close to recovery of the breadwinner jobs lost during the Great Recession, or since the 2000-2001 peak for that matter.
Specifically, the Great Recession resulted in the loss of 5.7 million or 8% of all breadwinner jobs in the US economy. As is evident in the graph below, all of the gains since the recession ended in June 2009 are born-again jobs, representing barely half of the original loss. The truth is, the American economy still had nearly 3 million fewer breadwinner jobs in September than it had at the 2007 peak and almost 4 million fewer than the high water mark back in 2001.
A decade and one-half of rampant money printing—-during which the Fed’s balance sheet exploded from $500 billion to nearly $4.5 trillion or 9X—-has thus been no blessing whatsoever for main street households, even as Wall Street has been gifted with opportunities to scalp prodigious windfalls from two giant financial bubbles.
What the monthly jobs telethon is actually counting for the most part is part-time jobs in retail, lodging, restaurants and temp agencies which are dumped unceremoniously during the downturn (i.e. without severance) and then are steadily reborn as incomes recover in the upper end of the household distribution.Thus, unlike breadwinner jobs where only 50% of the recession loss has been recovered to date, the 7% decline in part-time jobs was recovered by early 2013. Accordingly, the count of part-time jobs now stands 1.4 million or nearly 4% above the 2007 peak.
Unfortunately, the average annualized pay rate for jobs in this category is about $20,000 or just 40% of breadwinner job pay. Not only does this knock the idea of headline job equivalence into a cocked-hat, but even here it can not even be said that America has a part-time jobs machine.
When the Fed’s boom-bust cycles hit their hard-landing phase, the job loss is so severe that the trend never catches up. Since Bill Clinton exited the Oval Office in January 2000, therefore, the average gain in part-time jobs has only been 22,000 per month. At 40% pay rates, that’s a drop in the bucket compared to 150,000 per month of labor force entrants who could work full time and would surely covet an opportunity for full pay.

In truth, even these modest gains in part-time jobs may not be all they appear to be. Fully 3 million of the 4 million job gains in the part-time economy since 2000 have been in restaurants, bars, hotels, stadiums and other places of entertainment. These are the jobs with the absolute lowest pay, fewest hours, barest benefits and least security within the part-time world. Moreover, to some substantial degree they represent merely the monetization of what used to be unpaid and uncounted household hours in the home kitchen.

By contrast, in the goods producing economy the US lost 3.6 million jobs during the Great Recession—- or one-seventh of all jobs in construction, manufacturing and mining/energy production. As shown below, only 21 percent of those lost jobs have been “born again”. Indeed, the 19.2 million goods producing jobs are still 5.5 million or 22% lower than they were at the turn of the century.
Needless to say, jobs in this sector do generate something which approximates a living wage. According to the BLS, the typical position here generates about 40 hours per week at an average rate of $25 per hour—the equivalent of $50k per year on a run rate basis.
It is also the case that these higher paying goods-producing jobs help pull the freight in the US economy because they add to exports or reduce imports. Notwithstanding the Keynesian delusion that we can borrow from the rest of the world indefinitely, the fact is we import $2.5 trillion worth of goods and services from the rest of the world annually—-and sooner or latter the half trillion shortfall after exports must be paid for.

That obviously can’t be accomplished by the one sector of the job market that has actually been growing since the turn of the century–namely, the HES Complex (health,education and social services). As shown below, the HES Complex generated 51,000 jobs per month during 2000-2007 cycle and even 43,000 per month during the Great Recession.
The problem is that the HES Complex is almost entirely fiscally dependent. That is, it’s fueled by about $1.5 trillion per year of government spending for health care through Medicare, Medicaid and related programs and more than $1 trillion per year for education at all levels. Even employer paid health care is heavily dependent upon upwards of $200 billion per year in tax benefits and subsidies.
The obvious fact of fiscal life, however, is that governments at all levels are broke and freighted down with debilitating debt burdens that will increasingly put the squeeze on HES funding, and therefore hiring. In that respect, the slight easing of the Federal deficit during year six of the business recovery is no consolation whatsoever.
Uncle Sam’s annual deficit will soar back across the trillion dollar level with the next recession, and there surely will be one not too far down the road. So rather than put their fiscal houses in order by paying-down their recession swollen debt loads, governments from city hall to Washington have continued to pile it on. Accordingly, they head into the next recession with $18 trillion of Federal debt plus upwards of $4 trillion at lower levels of government. That totals to 130% of GDP. It thus constitutes a monumental fiscal roadblock—-a barrier that stands squarely in the way of job expansion in the HES Complex at anything resembling the historic rates.
As is evident below, the HES job gain rate has already fallen to just 28,000 per month since June 2009. And the trajectory can go nowhere except down from here.

At the end of the day, the US economy has not generated a single net new job outside of the HES Complex since mid-2001. There were 107.8 million non-HES jobs then and there were 107.6 million reported last Friday. Worse still, we are still 1.5 million jobs below the 2007 peak.
Stated differently, during the Greenspan Bubble of 2001-2007, the US economy at least gained several million non-HES jobs from the prior peak. This time we are still peddling backwards.
You would think that one of these days the labor market expert running our monetary politburo might notice. But you would be wrong.